The movement of goods and people tells of great structural change and waves of optimism and pessimism
In the world of structural change, there is perhaps nothing more revealing than the movement of goods and people. In this special update on the U.S., we will cover the long recorded and storied history of transportation to highlight our new data additions and to also shed light on the effect of the lockdowns on the economy.
The chart of interest concerns the measurement of movement. The movement of people is measured in miles traveled by air, road, and rail. The chart below highlights many of the structural changes over the past century. From the use of rail and the Pullman car in the early part of the century to the rise in airline and vehicle miles traveled. Importantly, travel is not a function of time as it is a function of depression and optimism, the policy-mandated structural changes, and personal preferences and costs. Each one of the series below shows that travel picks up in expansions and falls in recessions. WW2 saw a great pick-up in the miles traveled by ordinary everyday Americans. Innovations in air and vehicle transport have seen a great rise in use and reflect the rise of American labor market mobility and business travel.
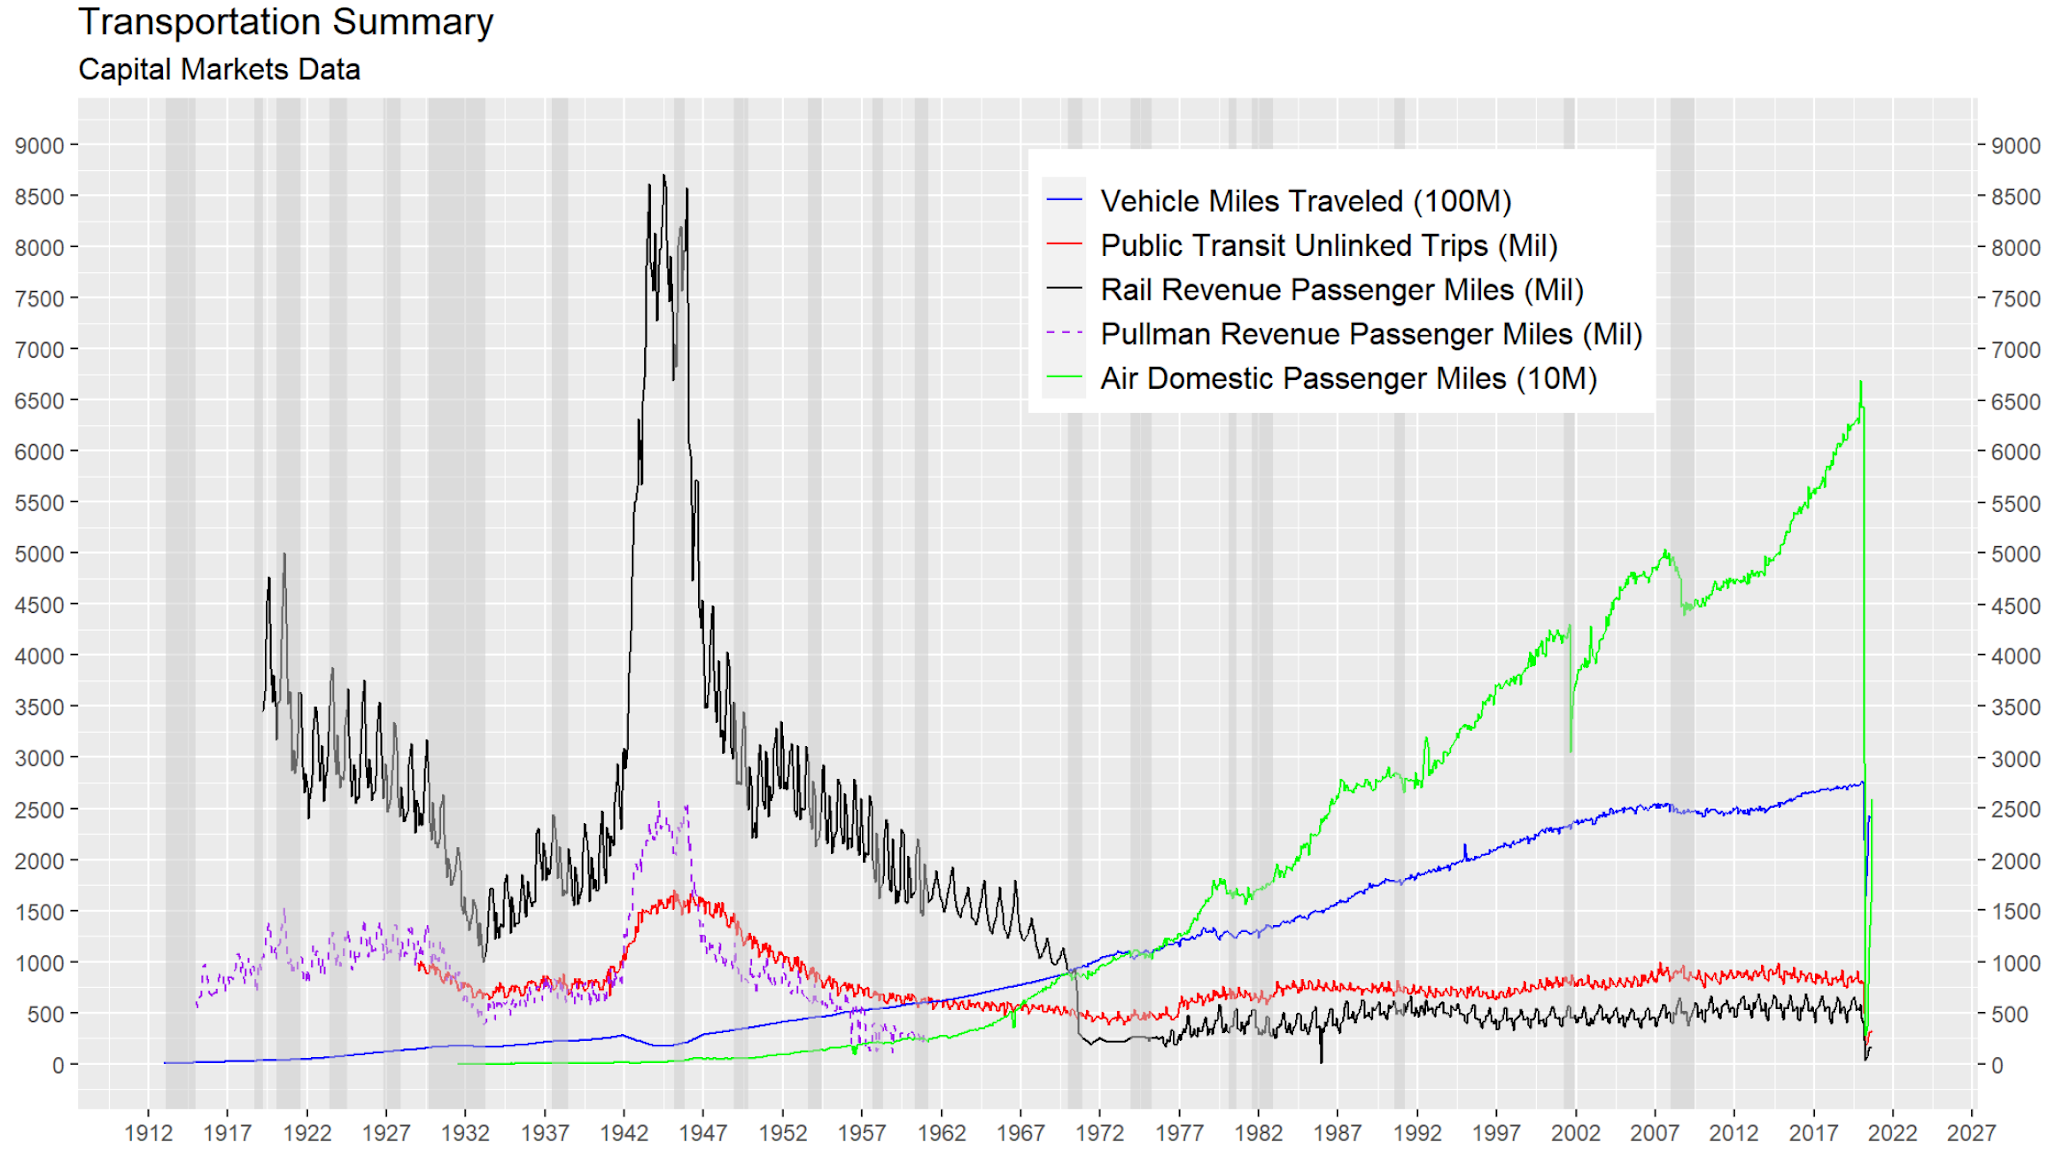

Other major developments have shaped travel in years past and will continue to do so in the years ahead. Look no further than that of international arrivals and departures for examples of cyclical and secular factors shaping the human condition. During the Great Depression, immigration to the U.S. collapsed along with economic opportunity. WW2 saw the collapse of foreign immigration as countries took stock of human capital. In the United States, foreign travel was severely hampered by the domestic patriotism that swept the nation. Additionally, travel restrictions followed globally as nations adopted nationalistic ideals following the Great Depression and during WW2. During the latter, it was a matter of national security to limit foreign immigration.


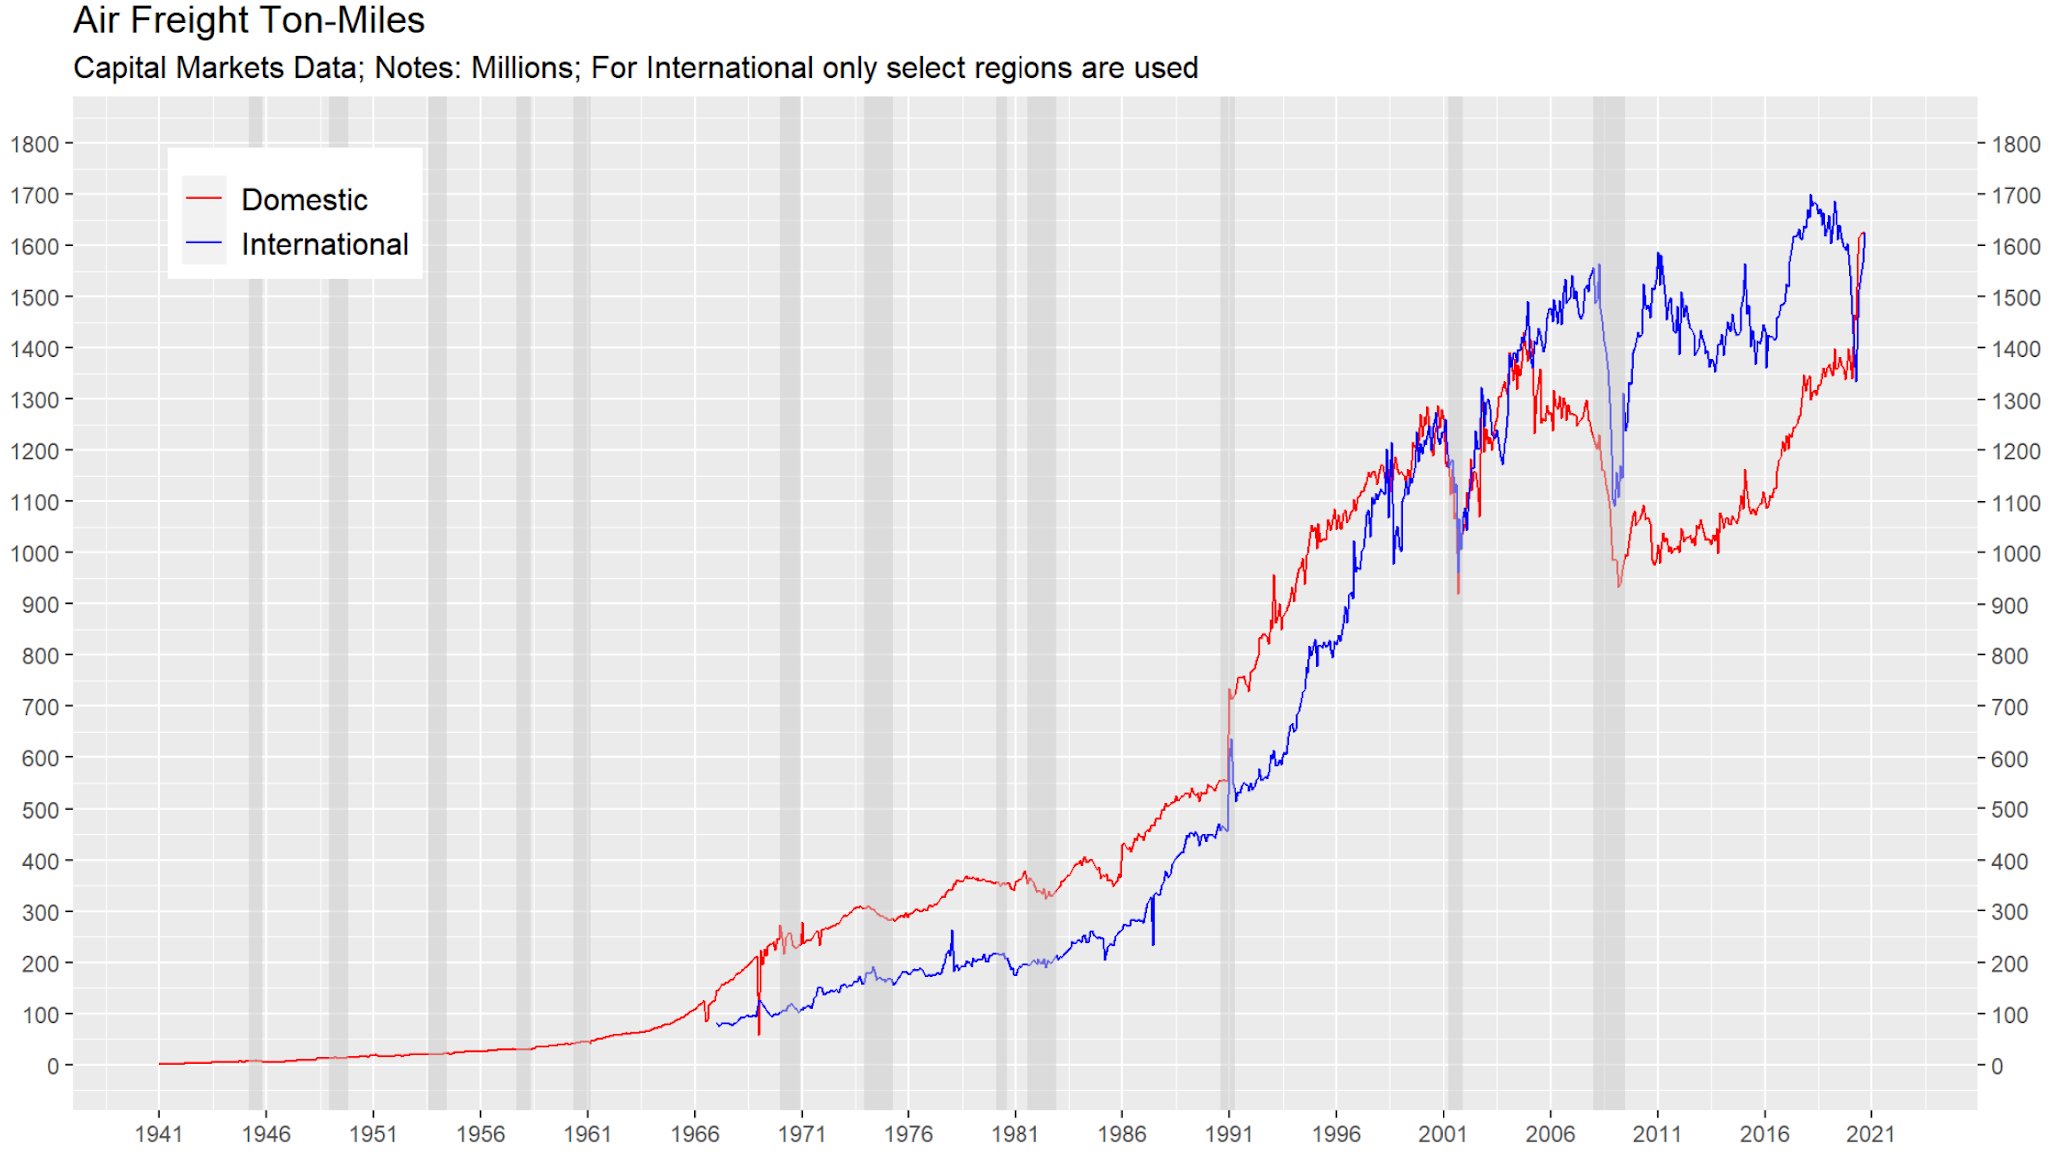
This pandemic has brought about changes in the movement of goods; witness the dramatic rise in domestic freight. This rise actually began in 2016 under the revolution in online commerce popularized by Amazon and Economic Nationalism perpetuated by Donald Trump.
Travel of all sorts has been impacted by the shutdowns. U.S. hotel occupancy has always been cyclical. During the Great Depression, occupancy fell from 70% down to 50%. During the 2020 shutdowns, occupancy has fallen a similar magnitude from 65% to 45%. This is no doubt presenting a difficult quandary for the hotel and accommodation industries.
The data measuring the fields of travel, tourism, and transit provide us a fertile breeding ground for understanding major structural and cyclical changes in human preferences. The historical data found in these charts are sourced from the Survey of Current Business, the underlying monthly details data provided by the BEA, and data from the Department of Transportation. They tell a story of policy changes, depression and optimism, fear and human taste. Much like the functional purpose of transportation itself, transportation data not only tell us where we have been but where we are going.